
Boy meets girl. They go on one date. They fall in love. They live happily ever after.
Wait a minute, it’s not usually that simple. How many people actually say “I love you” on the first date? According to one survey, it takes a couple an average of 14 dates before they speak those three words. I know most of you reading this aren’t here looking to understand analytics for your online dating site, but this idea can be applied to any digital equivalent of “I love you,” i.e. a conversion.
We’re talking about the kind of scary and confusing “assisted conversions” in Universal Analytics. You’ve set up some goals and started tracking those conversions. Through exploring “Goals” under the “Conversions” tab you see that organic traffic is your largest source of goal conversions. Wahoo! Free conversions! To hell with Google Ads and paid marketing!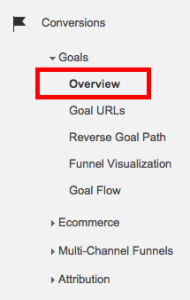
Hold on — let’s take a step back. If we only look at the most recent way the user came to the site before converting, we’re only seeing a tiny portion of a user and a site’s relationship. It’s like skipping the whole romantic comedy and only watching the last 10 minutes of the movie when everything falls into place and they live happily ever after. What about the first 80 minutes? We can ask the same question for conversions — what about the other channels? How did they help with the final conversion? How many days did it take that user to convert? How many interactions did they have before subscribing to your email or donating to your cause? These are important questions for nonprofits to ask. With limited time and resources, nonprofits need to be as efficient as possible with their marketing efforts.
It takes 14 dates(avg) before couples say 'I love you', what about your website users? Click To Tweet
What are assisted conversions?
Instead of always giving credit to the LAST way a user came to the site, we can determine the value of all channels through what Universal Analytics calls “Assisted Conversions.” A user usually has multiple interactions with your site before she converts. She may have found you when she Googled “best nyc volunteer opportunities,” then she saw her friend’s Facebook post about the amazing volunteer experience he had with you, and then she finally decided to sign up as a volunteer by going directly to your site. Based on the “last click” model, “direct” would get 100% of the credit for her conversion. But what about her organic search and the social click? They get no credit for the role they played in convincing this user to sign up. Assisted conversions, on the other hand, calculates how often channels appear in that conversion pathway.
“Multi-Channel Funnels” and “Attribution” under the “Conversions” tab give us an abundance of data on assisted conversions. Maybe even too much data. Yup, I said it.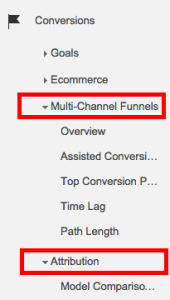
So what do you look for? We’ll walk you through one metric and one tool in analytics that you can easily understand, bring into your next digital marketing meeting, and use to blow your boss away.

Online Course
Google Analytics for Nonprofits
Master Google Analytics to drive impact!
Assisted / Last Click or Direct Conversions Ratio
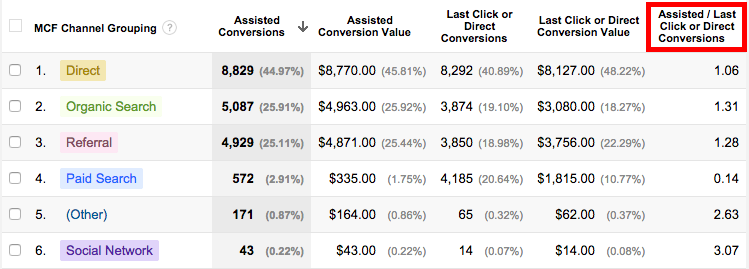
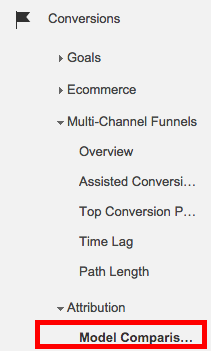
You can find this metric in the “Assisted Conversions” section of the “Multi-Channel Funnels” tab.
But before examining the ratio, let’s define exactly what “Assisted” and “Last Click” are:
- Assisted means the channel is in the conversion pathway, but not the final interaction before a user converts.
- Last Click or Direct means the channel is the very last interaction a user has before she converts.
This is probably the most important ratio you need to understand assist value. So pay close attention. Assisted / Last Click or Direct Conversions is exactly what it looks like. It is the total number of assisted conversions a channel had divided by its total number of last click or direct conversions. Simple, right? The key to this ratio is understanding what its position means:
- If a channel’s Assisted / Last Click or Direct Conversions ratio is closer to 0, then it
- is more likely to be the final interaction a user has before converting.
- If a channel’s ratio is 1, then it is equally likely assist and complete conversions.
- If a channel’s ratio is greater than 1, then it is more likely that the channel is further down in the conversion pathway than the final interaction.
One ratio is not “better” than the other. Think back to our volunteer in the example above. She probably wouldn’t have signed up if she didn’t have her first two interactions with your site. So what do these ratios mean for you? When you know a channel’s usual role in the conversion pathway, your marketing efforts should reflect that knowledge.
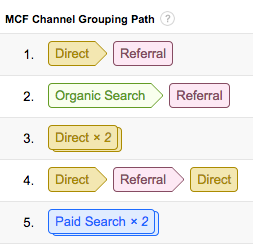
Pro Tip: If you know that one channel assists more often than it converts, use “Top Conversion Paths” under “Multi-Channel Funnels” to see what converting channel often works with that assisting channel. If you see a pattern, think about creating campaign content that marries those two channels.
Model Comparison Tool
Oh, Model Comparison Tool. How I love you. You make it so easy for me to look at two attribution models and see just how wrong the Last Interaction Model really is.
Don’t let this tool freak you out. It looks complicated, but here is what you need to know:
- Google has seven unique attribution models. (More on those here.)
- You can compare two at a time.
- You can change the “Lookback Window” to up to 90 days prior to conversion. Play with this time frame based on your site’s Time Lag Report. This means look at how long it usually takes a user to convert and set your “Lookback Window” to that time period.
- You can compare models by total conversions or by specific goal.
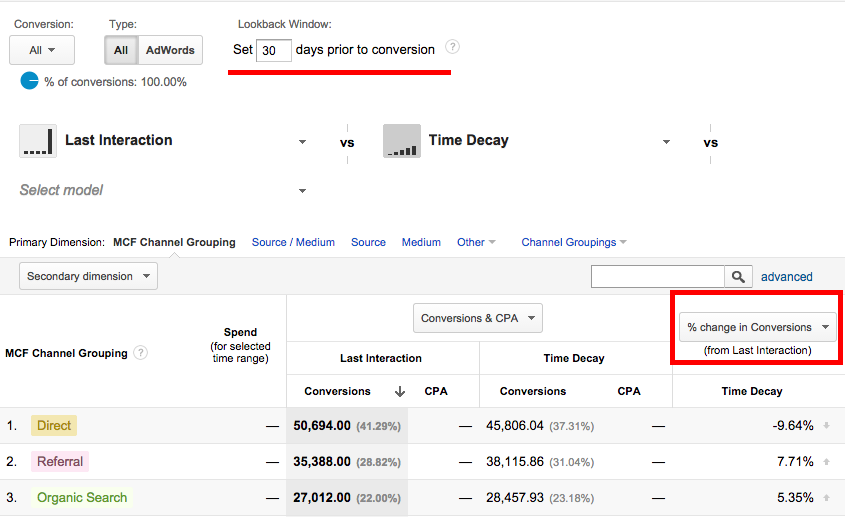
Pay attention to % change in Conversions. This tells you the percentage change in conversion attribution across models. For example, when I compare the “Time Decay” to the “Last Interaction” model, my “Direct” channel conversions drops -9.6% while all other channels increase. Interesting…
Pro Tip: Time Decay is the best model. Period. It gives the interactions closest in time to the conversion the most credit. The further away in time to the conversion, the less credit the channel gets. Crediting conversions is nearly impossible and this model is about as close to correct as Google Analytics gets.
3 Things to Remember
Cookies
Google uses cookies to track interactions and determine assists. Google defaults the lookback window to 30 days, but it can go as far back as 90 days. What if someone takes longer than 90 days to convert or clears their cookies? You’re out of luck.
Direct traffic
Sometimes I think Google tries to confuse you. Example A: Let’s say a user clicks over to your site from a “referral” and then returns to convert as “direct” traffic. If you’re looking at regular ol’ conversions, Google will attribute one conversion to “referral.” If you’re looking at the Multi-Channel Funnels reports, Google Analytics will attribute one conversion to “direct” and one assist to “referral.”
Multi-Channel Funnels Report lag
You look at your conversions overview and then you open the Multi-Channel Funnels report and uh-oh, the numbers don’t match up. Don’t worry — the MCF report lags two days, so if the conversion data isn’t the same as on other reports, no need to freak out.
Time to go on some dates with your analytics data. We gave you some tips. Told you what to look out for. Now you and assisted conversions can live happily ever after.* If you have any questions, send an email to [email protected] and let us know how we can help you.
*Pro Tip: Keep your partner (Google Analytics) happy by knowing how they’re doing.