
Sending marketing emails for your organization can require a lot of creative energy and strategic coordination. But if you’re not using any kind of email report to look at the performance data of these emails once they’re sent, how do you know that all of your energy is making an impact? How do you know what works, and what doesn’t?
This is why you need a robust email report that makes trends and results easy to see by compiling relevant email data into one place. Sure, you want to see the number of clicks and opens each individual email receives,. But to get a fuller picture of the highs and lows of your nonprofit email marketing strategy, you’ll also want to see changes in your email acquisition rate or what actions your email subscribers take on-site.
We’re big fans of Mailchimp, one of the most widely-used email service providers that also offers a nonprofit discount, and have created an email report template in Data Studio that offers a way to pull in both Mailchimp performance data and email traffic data from Google Analytics. Use this email report template to understand trends in send times, segment performance, email signups and more.
Ready to dive in? First, some terms to know.
Email report glossary
Run through these email marketing terms and definitions before diving into our email report template for maximum insights and impact!
- Email type: The different kinds of emails you send from your marketing account, differentiated by purpose, frequency and/or recipient segment
- Open rate: The number of opens on an email divided by the number of people that were sent the email. Mailchimp reports that the average for nonprofits is 24%.
- Click rate: Also known as click-through rate (CTR). The number of clicks on an email, divided by the number of people that were sent the email; Mailchimp reports that the average for nonprofits is 2.57%.
- Unsubscribe rate: The number of people that unsubscribe from your list divided by the number of people that received the email. Aim to keep this below 0.5%.
- Lead funnel: The marketing funnel that takes your site users from aware to engaged, with the ultimate email cultivation goal being an opt-in to your email marketing list
- Data Studio: Google’s data visualization tool that makes it easy to load, present and share data from multiple sources in customized reports
- On-site: Action or activity that takes place on your website versus within your email campaigns or a user’s inbox. This is recorded by your website analytics.
- Email bounce rate: The percentage of recipients on your email list that didn’t receive your email because it was returned by a recipient’s mail server
- Website bounce rate: The percentage of people who land on your site and then leave without clicking around to reach additional material or pages.
- Conversion rate: In Google Analytics, the percentage of visits that result in a goal being completed
- Traffic channels: In Google Analytics, the different categories that organize your website traffic (Direct, Organic, Social, Email, Referral, Paid)
Finding insights in your email report
Our Data Studio template provides a jumping-off point for your standard marketing email reporting. Building on open and click-through rates, this template allows you to assess your lead nurturing funnel, email performance data, and resulting impact subscribers have on-site. We’ve broken this template down into 3 sections:
Page 1: Individual Email Performance
Page 1 of this email report gives you a performance overview of each individual email campaign sent, including send date, day of the week, subject line, number of recipients, open rate, click rate, and unsubscribe rate. You can adjust the date range, as well as toggle between your email lists if you have more than one. Use this page to ask and answer questions such as:
-
- What subject lines get the most opens?
- Which segment and/or email type gets the most opens?
- Which segment and/or email type gets the most clicks?
Page 2: Trends in Email Performance
Page 2 helps to call out broader trends by outlining email performance by Mailchimp list (including recipients, average open rate, average click rate, and average unsubscribe rate) as well as email performance by day of the week. Use this page to ask and answer questions such as:
-
- Which list gets the most opens?
- Which list gets the most clicks?
- Which list sees the highest unsubscribe rate?
- What days of the week get the most opens?
Page 3: Email Performance On-site
Page 3 of the email report pulls in additional data from Google Analytics to help you understand how traffic from your emails performs on your website in comparison to other traffic channels, pulling in information about the number of sessions, bounce rate, and goal conversion rate. Use this page to ask and answer questions such as:
-
- What is the monthly rate of email signups?
- Which landing pages capture the most email signups?
- Which traffic sources drive the most email signups?
Data Studio prerequisites and template directions
You’ll need a Google Account to link your data to our Mailchimp template and should use the same account across Google Sheets, Google Data Studio, and Google Analytics (if applicable). Manager access is required to download all reports in Mailchimp.
- Login to Mailchimp and navigate to Reports
- Click Download All Reports and locate the Campaigns CSV file in the downloaded zip file
- Now open Google Sheets, create a new sheet, and upload the Campaigns CSV by choosing File → Import → Upload
- Name your file and then open Whole Whale’s email template in Data Studio
- Select File → Make a copy
- When you copy the report, you will be prompted to add data sources of your own
- In the first row, select Create New Data Source and choose Google Sheets from the list of Google Connectors
- Locate your worksheet and click Connect
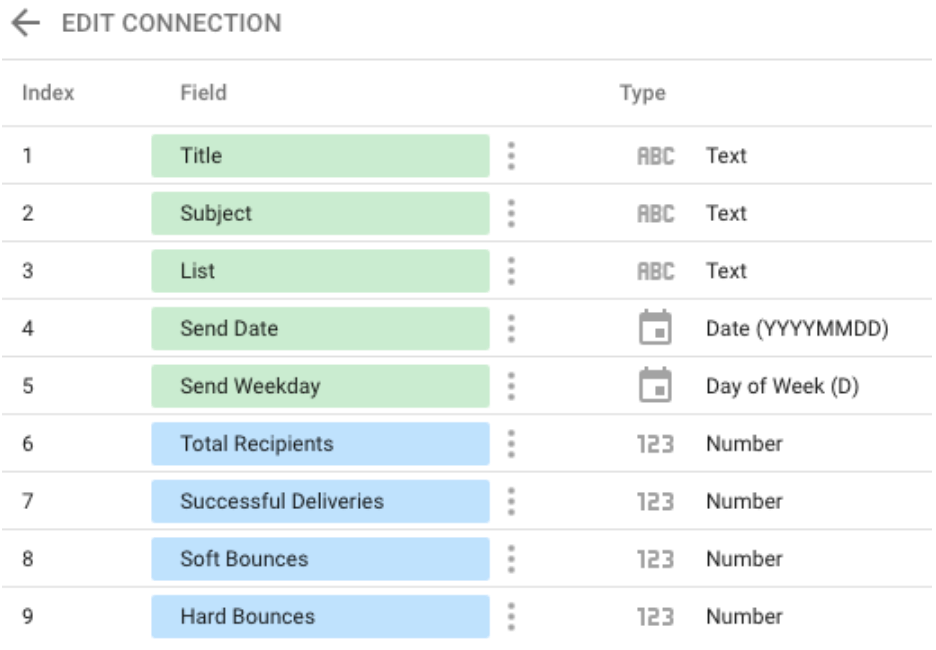
- When prompted to Edit Connection, change the data type for Field Send Weekday from Text to Day of Week (D)
- Click Add to Report to apply your Mailchimp data to the report
- Next, replace our placeholder Google Analytics data with your own. If you don’t have a Google Analytics account, we highly recommend getting one
- Finally, select Copy Report and get to analyzing!
Now that you’re analyzing your email data, there’s no stopping what your marketing efforts can do. Use insights from your email report to help direct Mailchimp-specific A/B testing ideas, template design updates, donor messaging and more. Looking to do it all? Check out our complete guide to nonprofit email strategy.