

About the Nonprofit Advertising Benchmark Study
The study was conducted from Form 990 data from 7,171 U.S. 501(c)(3) organizations with $1 to $10 million in revenue from 2018-2019 courtesy of Cause IQ (filing years 2019 and 2020). The goal was to create a large enough sample size to answer questions about advertising size for nonprofits that rely on common funding methods.
There are 1.44 million 501(c)(3) nonprofit organizations, about 5% (72k) are between $1M and $10M in revenue, 1.5% (21.5k) are above $10M.
This study represents a full population of nonprofits that fit the study criteria. The study criteria removed chapter organizations, childcare educational institutions, organizations with no employees, and hospitals because of their different revenue-generating operating structures.
This study relies on the reported advertising field in the Form 990. The IRS defines the advertising field (line 11 on section 9 of Form 990), as ad spend itself and direct costs for independent contractors executing said ad spend. However, line 11e may also include some of the costs associated with advertising consultants and is determined by the organization’s filing decision.
This study is a partnership with Whole Whale, a B Corp digital agency that helps nonprofits use their resources wisely and Cause IQ, the leading nonprofit data platform.
The Question: How much should we spend?
How much should my nonprofit spend on advertising?
The simplicity of this question belies the complexity of trying to find comparable organizations and then understanding their ad spend. This question is especially important as social platforms like Facebook/Instagram/LinkedIn continue to reduce organic reach.
Download the Full Advertising Benchmark Study | (free)
For the full study including information across the following findings, please enter email below.

The Answer

The point of this study is to give a better answer than the cliche “it depends” or “how long is a piece of string”. The answer can simply be to try a sample budget that matches the current mean spend of organizations that match yours. Alternatively, based on some of the findings, it may reveal that there is a simple ratio of ad spend to revenue that can determine spend.
The first decision should be whether to spend money on advertising. Of the 7,171 organizations in the study sample, 40% (2,846) did not have ad spend and 60% (4,325) did have ads recorded as an expense in their Form 990.
So, to the question ‘should my organization spend on ads?’, the answer is most organizations in the revenue range of $1M to $10M do spend some amount on advertising.
Regarding the question of ‘how much?’, the study’s findings will help frame ways to segment data and start you thinking about the ad spend opportunity. Or you can just go with 42, the answer to the ultimate question.
The Advertising Benchmark Findings
The Whole Whale team analyzed the data across several segments to reveal insights about how different nonprofits approach ads based on their size and age. Additionally, data about event fundraising was included to get a better understanding of how ad spend potentially amplified results.
The following are 2 of the 7 key findings:
Finding #1: *Most* Ad budgets are around $12k or .5% of revenue
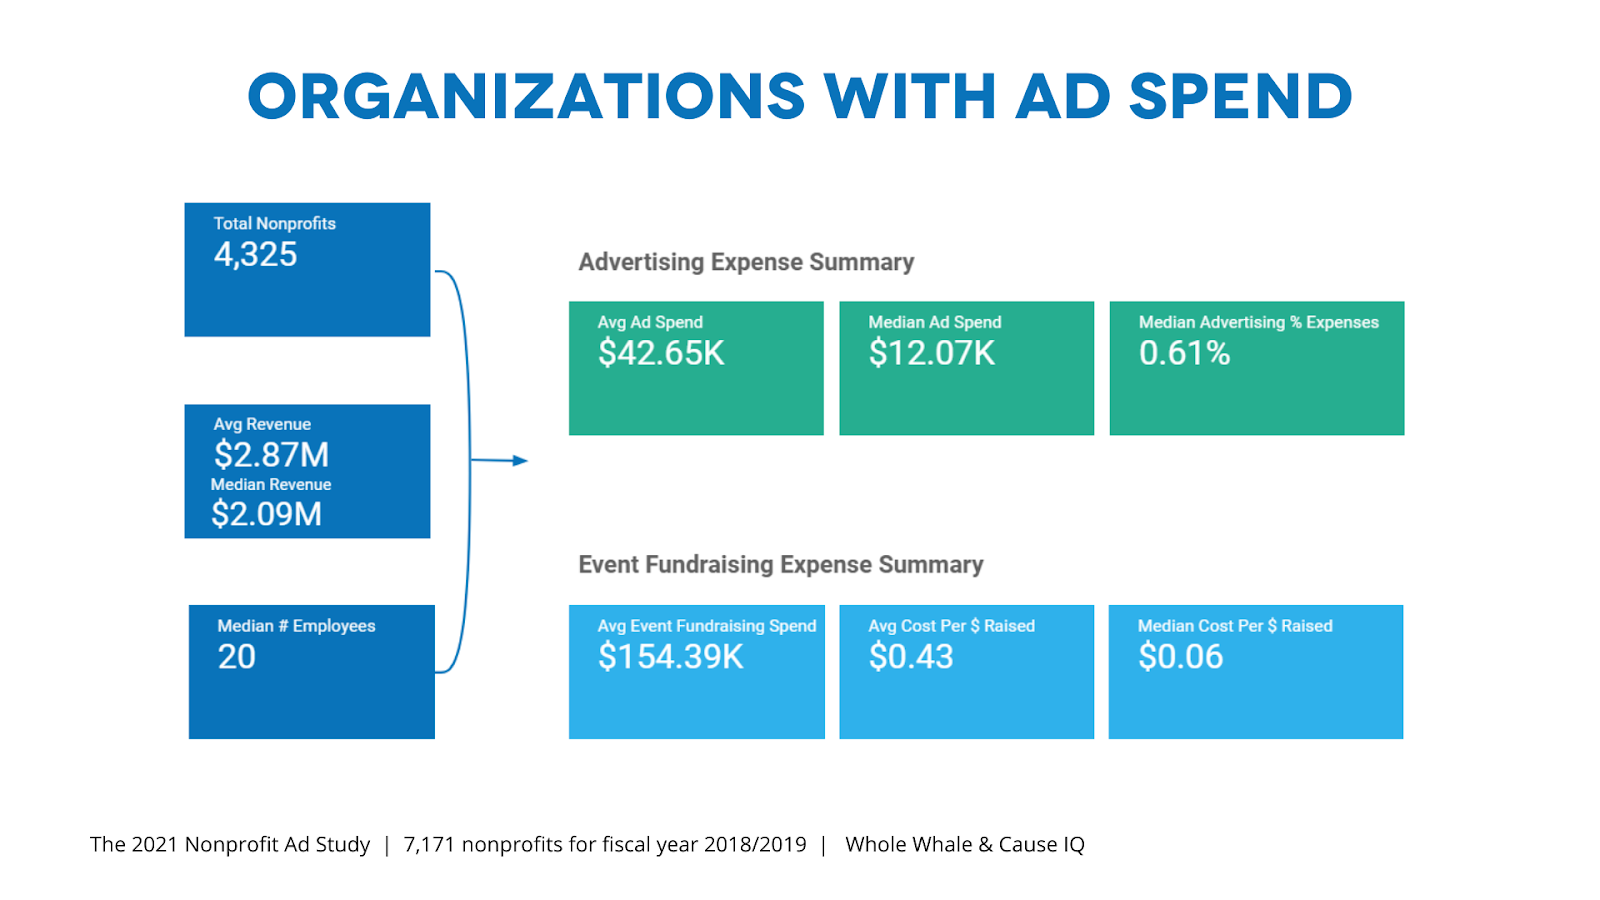
As noted in the introduction, the study group showed that 60% of organizations have an ad spend. Looking at this ad spend group reveals that the median (or midpoint) advertising spend is $12,070, or around an average $1k per month in ad spending. For this ad spend group, ad costs represent .6% of expenses.
The ratio of average ad spend to average revenue is 14% and the ratio of median ad spend to median revenue is .5%. It is important to use the median here when deciding where your organization fits because the average is skewed higher due to 10 outlier organizations with over $1M in ad spend. This is explored further by the 80/20 distribution in finding #2.
Finding #2: Ad Spend Distribution follows the 80/20 Rule
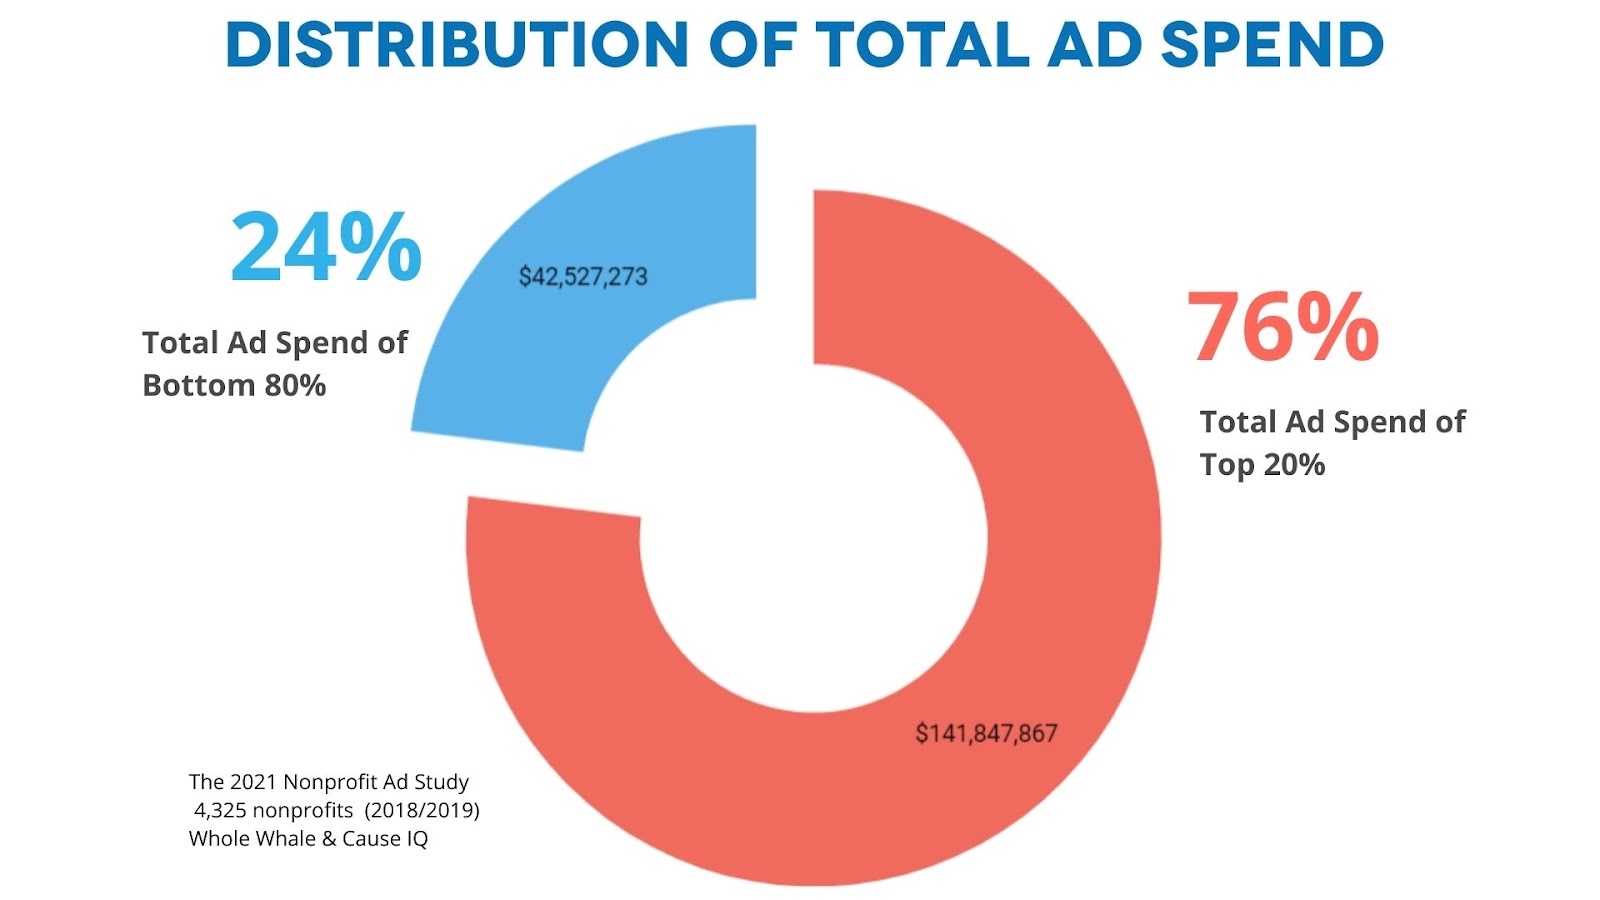
Reviewing the 4,325 nonprofits with ad spends, the data show that the top 20% (425) of nonprofits that spend on advertising represent 76% ($141M) of the total advertising spend of the study group. The 80/20 rule or power law, usually seen in monetary and sales distributions, would mean the top 20% of inputs would represent 80% of the outcomes.
The advertising spend distribution reflects this 80/20 rule with 80% of nonprofits spending a collective 23% ($42M) with a median spend of around $12K, meaning that the 80% distribution has a long tail of smaller ad spends.
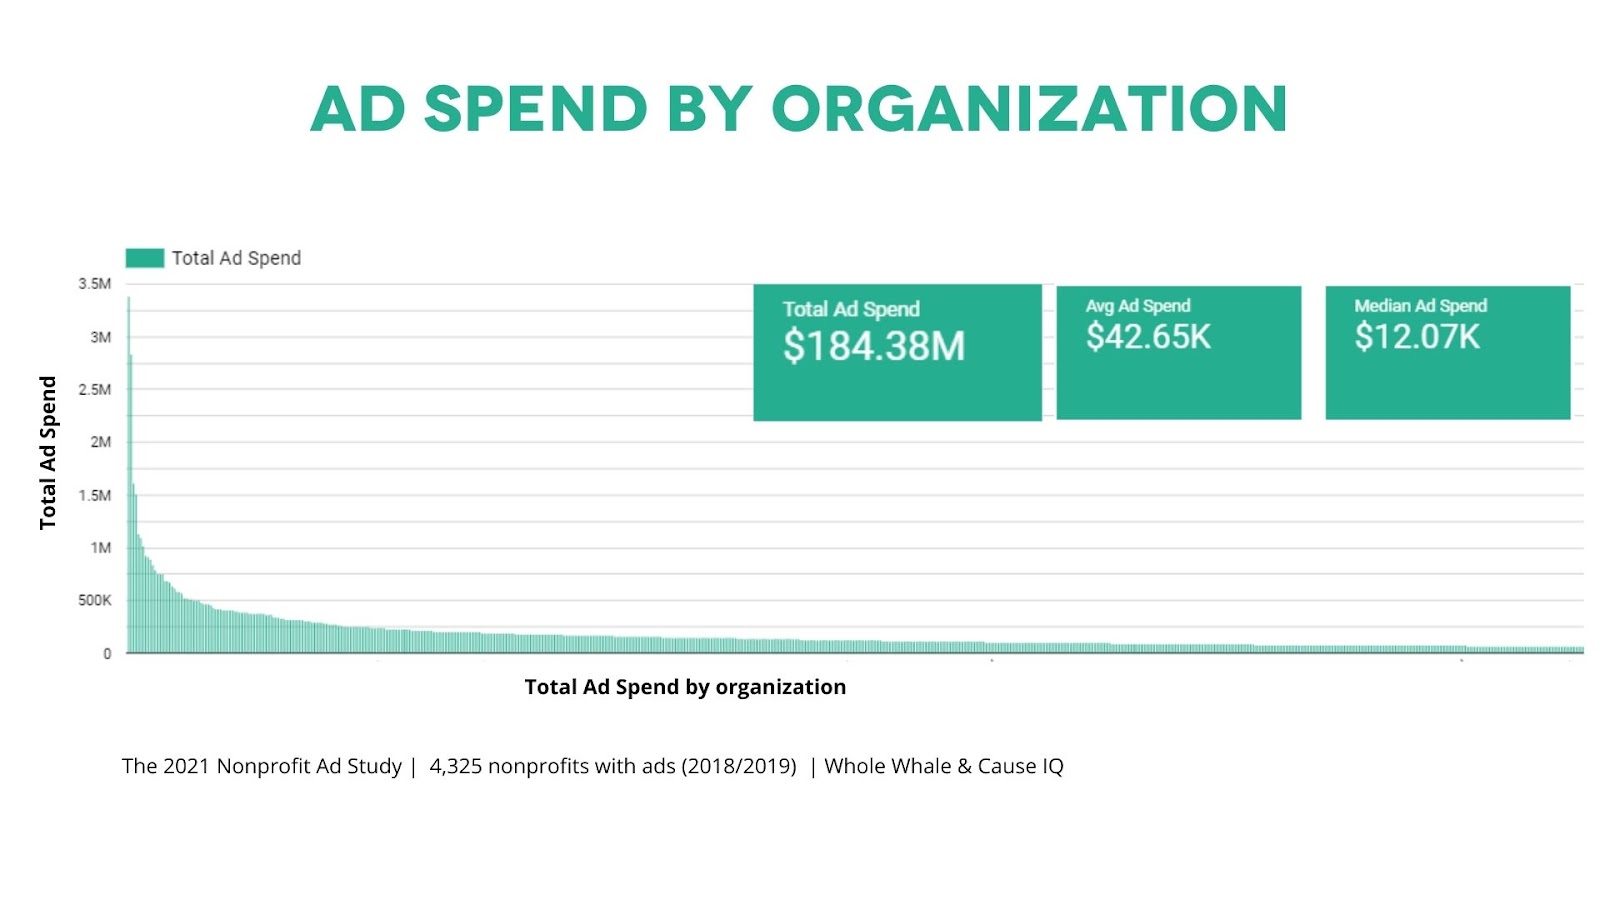
The full distribution shows how the top 13 organizations in the study spend over $1M, with the top nonprofit, Prolife Across America, spending $3.6M.
Findings #3-#7
- Finding #3: Ad Spend does not correlate to higher event income
- Finding #4: ‘Older’ organizations are less likely to spend on ads
- Finding #5: Larger organizations more likely to spend on ads
- Finding #6: Arts organizations lead the pack in advertising
- Finding #7: It takes at least 5 Employees to run ads
Buy the full Dashboard, Study, and Data
Who is Cause IQ?
Cause IQ provides business data on the nonprofit sector to help organizations find funding, research nonprofits, and grow their nonprofit client base. Cause IQ’s customers including leading nonprofits and service providers to the nonprofit sector. Cause IQ’s website combines over a dozen data sources on nonprofits — Form 990s to Form 5500s, A-133 audits to custom research — with purpose-built tools to make the data searchable, accessible, and downloadable.