
Twitter Analytics is a great (and obvious) place to start if you’re looking for data to inform your social media strategy on Twitter. You can learn everything from Twitter stats, including how your following has grown to how Twitter traffic to your website converts into your overall site #goals.
But is Twitter Analytics… good?
While Twitter Analytics doesn’t collect as much data as other social analytics platforms like Facebook Insights, the data Twitter Analytics does collect speak volumes — if you know how to listen.
In this article, we’ll look at how to have a conversation with your data. We all know that communication is the key to a healthy (data) relationship, and knowing what questions to ask your data will help you improve your Twitter content strategy while letting your data know that you truly care.
How do we do this? To start, you can access Twitter Analytics by visiting analytics.twitter.com. At the top, you’ll notice tabs for Tweets and Audiences. These are the sections which we’ll be focusing on (Twitter Cards are a bit more involved). Ready? Here we go.
Questions to ask your Twitter Analytics data
1. How is our following growing?
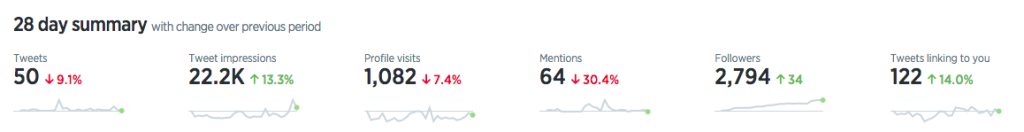
The first data you’ll see in your Twitter Analytics Home section will look similar to screenshot above.
This section shows you the number of tweets, impressions, profile visits, mentions, followers, and tweets linking to your account over the last 28 days. Twitter Analytics compares these data to the previous period.
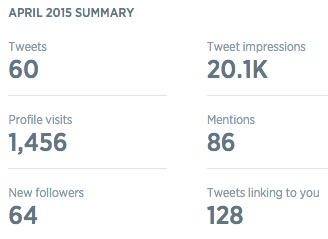
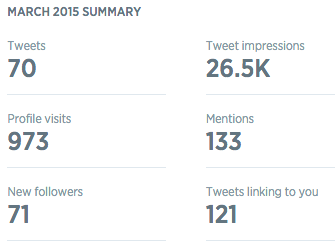
The Home tab also offers a monthly summary so that you can track your growth month-over-month. You’ll find these summaries on the right side of the page below the 28 day summary.
If you want dive a little deeper into engagement growth, click on the Tweets tab and on the far right side you’ll see a daily breakdown of engagement rate, link clicks, retweets, favorites, and replies.
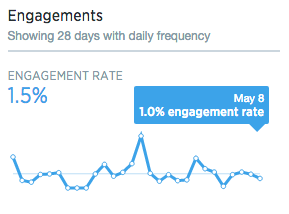
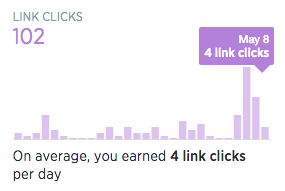
You’ll notice that all of these data graphics are fairly intuitive and don’t require any advanced degree in statistics to decipher. All that is required is knowing what to look for and knowing how to use this information to make changes around your Twitter marketing strategy.
Questions to ask your Twitter Analytics data:
- Which days did we see a lot of mentions?
- Was there any period that lagged in new Twitter followers?
- Is our growth consistent and sustained?
Twitter data-driven actions to take:
- Once you have the above answers above, the next step is to discover the reasons behind these metrics. For instance, you might ask yourself:
- Why was there a spike in our tweets’ engagement on April 25th? Did we post something controversial? Did we use a popular hashtag? Did a celebrity or someone with a lot of followers retweet us?
- Find out what factors and actions drove your Twitter #wins and set about replicating them. On the flip side, if you experienced a period where your Twitter followers or tweet reach dropped, consider what went wrong and stop doing it.
2. What is working with our Twitter content strategy?
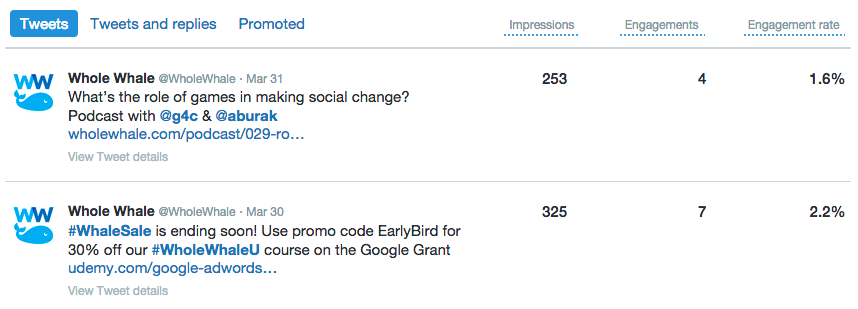
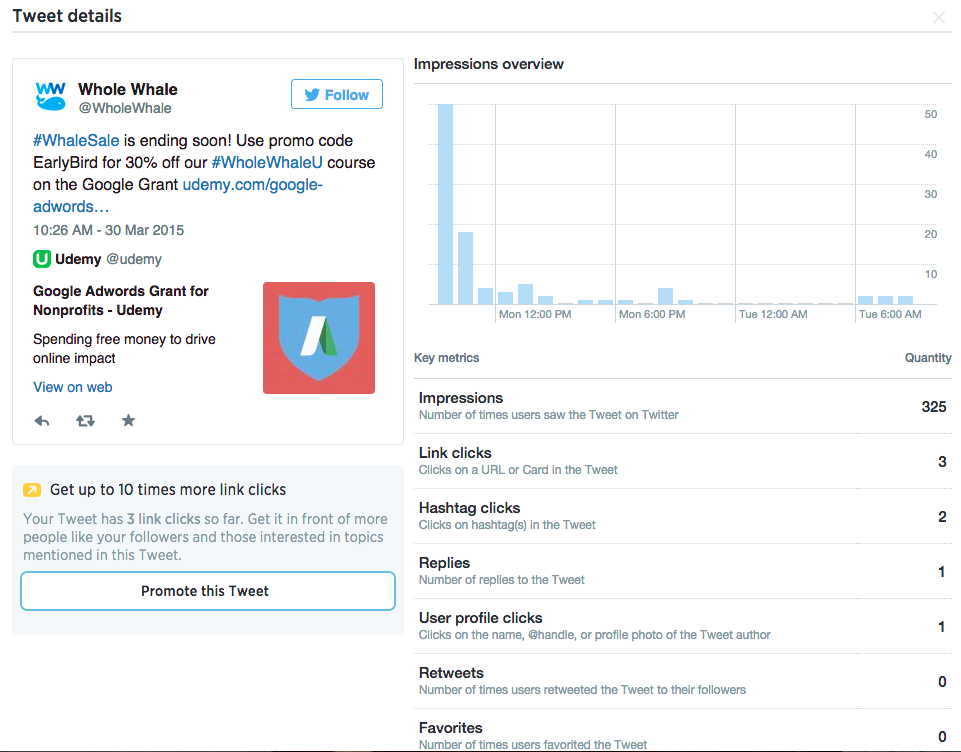
Your Twitter Analytics dashboard allows you to gain a quick overview of your most engaging tweets. The overview highlights your tweets that had the greatest number of impressions and engagement, as well as those with the best engagement rates. For any given tweet, click on View Tweet Details for a more in-depth analysis of engagement. You’ll see impressions by the hour, detail expands (people clicking to read more), link clicks, favorites, retweets, and replies.
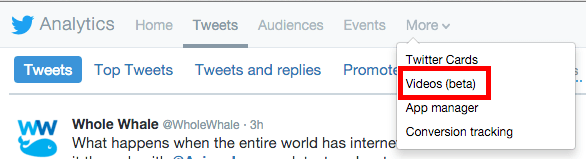
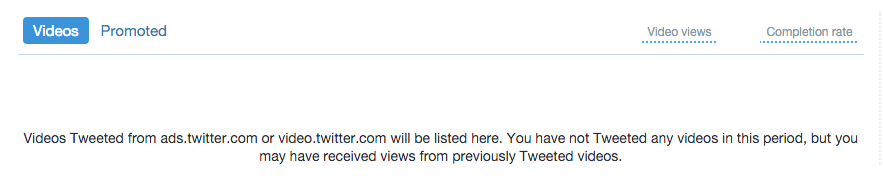
If you also post videos on Twitter, there is a Video Analytics section. Click on the More tab to find this section, as well as information on Twitter Cards, conversion tracking, and your app manager.
The new Videos section on Twitter Analytics looks similar to the Tweets section: Here you can see video views as well as a completion rate broken down by specific videos and the larger video trends for your audience. Metrics include total minutes watched and retention rates (if users start a video, how many get to 25% watched? How many get to 50%, or 75%? How many watch the whole thing?). If you work with a promoted tweets or promoted video strategy, you can also toggle between organic and promoted in this section.
Questions to ask your Twitter Analytics data:
- Is there a post style that leads to high engagement?
- Is there a #topic that gets above-average retweets?
- Is there a certain time of day, or day of the week, that tends to have higher engagement rates?
- How much of our videos do users typically watch (25%, 50%, 75%, 100%)?
Twitter data-driven actions to take:
Wondering what the social strategy for your organization should be? Use the answers to these questions to develop a fun and engaging voice for your organization:
- If photos get the most engagement on your Twitter timeline, post more of them.
- If posting about recent news events gets the most retweets, incorporate more of this in your Twitter content.
- Does a particular person have consistent interaction with your organization on Twitter? Or is a celebrity following you? Engage with them. Mention them in your tweets. Not all followers are created equal (just ask The Grassroot Project).
- Do your Twitter followers only watch the first 50% of your videos? Consider cutting down the length of your videos to fit within that average time frame.
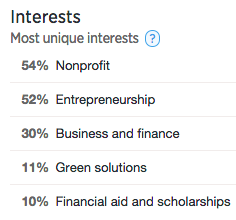
3. What are our Twitter followers interested in?
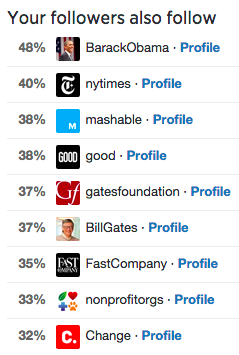
Knowing the demographics of your Twitter followers can and should help inform content creation. By using Twitter analytics to learn about their interests and other accounts they tend to follow, you can figure out what topics and ideas are most relevant to them. You can do this through key demographic information in the Followers tab. Here you’ll find gender, top interests, and the top individuals your followers also follow.
At the same time, it’s important to maintain a distinctive voice for your organization and to make sure that your tweets are related to your unique service.
Questions to ask your Twitter Analytics:
- What is our primary demographic?
- What accounts are our followers also most likely to follow?
- What do we have in common with those accounts?
- Does our content match our users’ interests and our mission and vision?
Twitter data-driven actions to take:
- Create a user personality (or a few) and try to think about what things they may be interested in. Have printouts of these personas above your computer to remind you of who you’re writing for when you’re creating content.
- Consider who influences your audience. You can reference these figures in ways that relate to your organizations and you can even try tweeting at these figures.
- Identify what topics interest your users most and tweet about them more.
4. When (and where) should we be most active on Twitter?
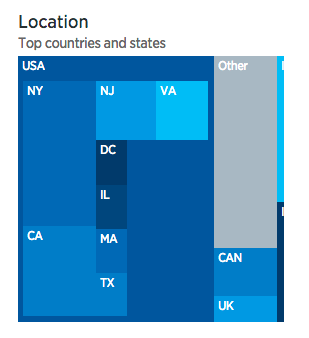
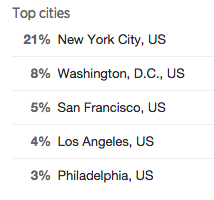
Twitter Analytics provides some highly useful location data about your followers. Analyzing where your followers reside can help show your nonprofit how far-reaching your impact is, if you’re reaching audiences that overlap with your work or donor base, and can help with targeting ideal timezones, days of the week, and hours for tweeting.
Question to ask your Twitter analytics:
- Where do our followers come from?
- Have we grown beyond a local appeal?
- Are we reaching our key audience areas?
- Are we reaching areas of impact?
- Are we reaching areas that represent our donor base?
Twitter data-driven actions to take:
- Tweet at a wider range of times to account for your fans across different time zones, or limit your hours if your followers are hyper-focused in one region. Note that this may not always be the region you’re tweeting from.
- Consider what topics might interest someone in your top city (i.e. sports teams of that city, local events, news, or retailers). Don’t get stuck speaking from a national perspective.
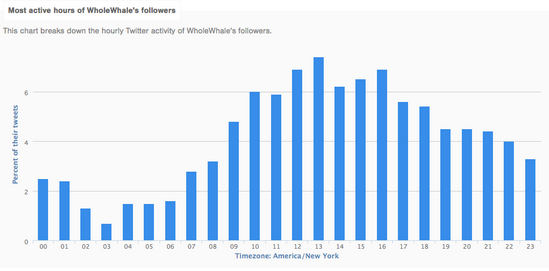
- Bonus: Check out what time your followers are active on Twitter for free using Followerwonk. You’ll notice below that over 40% of our followers’ Twitter activity takes place outside of our 9-5 hours.
#Conclusion
Remember: Metrics are the map, not the destination.
Any data you glean from Twitter analytics — or any analytics tool for that matter — will only give you clues about your organization’s performance. The next step after collecting data is to read between the lines and search for the real answers. Without the metrics, however, it’s nearly impossible to get this process underway.
Go ahead, your data is begging for some interaction. Strike up a conversation! Hungry for more social media analytics? Check out our Beginner’s Guide to Facebook Analytics once you think you have Twitter down pat.
Hey, don't forget to read between the lines of your Twitter Analytics! Share on X
Want to go deeper with your social media analytics? Check out our roundup of the top 7 social media management tools.